We’ve heard a lot throughout 2022 about how high energy prices are taking a toll on households across Australia, but the situation has not been any better for the nation’s millions of small businesses.
Energy Consumers Australia’s latest report tracking energy bills for small businesses (SMEs) is out – the first since the unprecedented market conditions in June this year that led to the suspension of the wholesale market.
Unsurprisingly, it finds that average annual bills are going up.
Certainly, SMEs are telling us they are less satisfied with the cost of energy supply, with our December Sentiment Survey finding a 12% decrease in satisfaction for electricity compared to a year ago, and a 9% decrease for gas.
But by how much are average annual bills going up? And how should the results be interpreted?
Small businesses across Australia are facing higher energy bills
On average nationally, annual electricity bills for SMEs consuming 20,000 kWh increased by approximately 19% ($1,120) between October 2021 and October 2022. The greatest increases are in NSW ($2,375 or 42%), while the lowest are in Western Australia ($165 or 3%).
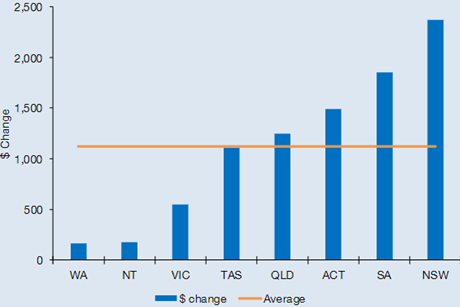 Chart 1: Changes ($) to average annual electricity bills for SMEs using 20,000 kWh (single rate) per annum in each jurisdiction from October 2021 and October 2022. GST inclusive.
There is a similar story for annual gas bills, which on average nationally, have increased for SMEs consuming 100 GJ by approximately 21% ($610) between October 2021 and October 2022. The greatest increases are in South Australia ($985 or 28%), while the lowest are in Tasmania ($160 or 3%).
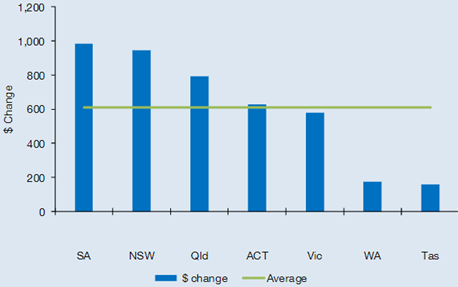 Chart 2: Changes ($) to average annual gas bills for SMEs using 100 GJ per annum in each jurisdiction from October 2021 and October 2022. GST inclusive.
However, interpreting the trends this time around is challenging, given the nature of the retail market response to the recent wholesale price volatility and increases.
The SME Tariff Tracker provides an important record of actual market offers that were available at a point in time, and provides a benchmark for measuring changes to bills over time.
When the market is steady, with limited disturbances, this analysis is relatively straightforward.
However, 2022 has not been such a year...
Shocks to the wholesale market causing shocking consumer outcomes
Significant wholesale price volatility and high wholesale prices have, in turn, led to retail market instability. The way that individual retailers responded to wholesale market volatility depended on how well they were hedged and therefore how exposed they were to high prices.
As a result:
- Some small retailers that traditionally had some of the cheapest market offers suddenly became the most expensive.
- Some retailers withdrew their market offers, leaving new customers to sign up on the typically more expensive default offer.
- Other retailers posted market offers well in excess of the default offer, potentially in an effort to turn away new customers.
- Some retailers encouraged existing customers to leave, telling them that they could find a better offer elsewhere.
- Finally, some retailers left the market altogether, either by choice or involuntarily.
This means there are fewer market offers available now than there were in May this year. In South East Queensland for example, there were 28 retailers with offers in May, and only 13 remaining in October.
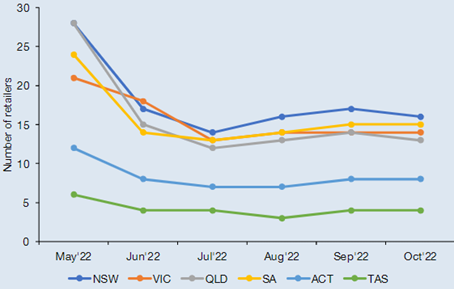 Chart 3: Number of electricity retailers with published market offers for SME customers from May to October 2022
In turn, this has meant that the analysis in our report must be treated with caution when comparing to previous years. While it continues to be an excellent indicator of trends and developments that are happening in the retail market, it is not necessarily a great indicator of what individual businesses are likely to be paying right now.
For example, a few very high-priced offers – potentially designed to limit retailer losses by discouraging businesses from taking them up – can distort the average level of all available offers. But such offers are unlikely to be directly impacting many individual businesses since they are unlikely to be taken up. As discussed in the next section, a few high-priced offers have also distorted a typical indicator of competition: price spreads.
High price-spreads do not necessarily indicate robust competition
Our analysis reveals that the maximum price-spread has increased substantially in all jurisdictions over the last year. (The maximum price-spread is the difference between the lowest and highest market offer available).
For SMEs with an annual consumption of 20,000 kWh, the highest maximum price-spread is in ACT ($6,870) and the lowest in Victoria ($2,695). We note Tasmania has not been included as they have only recently gained more retailers.
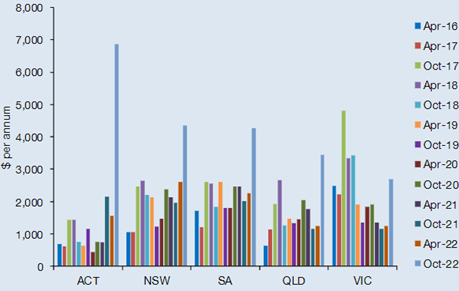 Chart 4: Maximum price-spread for electricity market offers (including guaranteed and pay on time discounts) in each jurisdiction since April 2016. Based on SMEs using 20,000 kWh (single rate) per annum, GST inclusive.
For gas, the maximum price-spread increased in all states, expect Tasmania and Western Australia, compared with the same period a year ago. For SMEs using 100 GJ per annum, the highest price-spread is in NSW ($2,975).
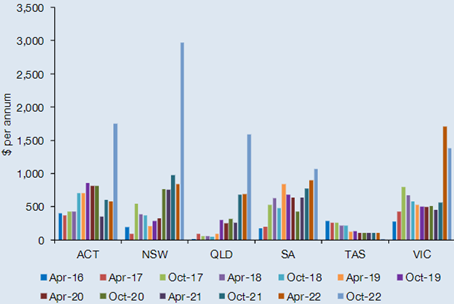 Chart 5: Maximum price-spread for gas market offers (including guaranteed and pay on time discounts) in each jurisdiction since April 2016. Based on SMEs using 100 GJ per annum, GST inclusive.
Traditionally, we view a high maximum price-spread as a sign of healthy competition in the market – as the outliers are typically on the lower end of the price spectrum. In other words, the price spread shows how different retailers are pitching their offers, in order to compete with each other for new customers and new business.
But while we are seeing high maximum price-spreads this year, the causes are quite different. As discussed, in this recent period high price-spreads have largely been caused by retailers seemingly pricing themselves out of the market.
For example, for SMEs in NSW with a consumption level of 20,000 kWh per annum, while most offers are clustered near or below the ‘big 3’ retailers’ (AGL, EnergyAustralia and Origin’s) average Default Market Offer of $8,000, a few outliers were around $10,000 to $12,000.
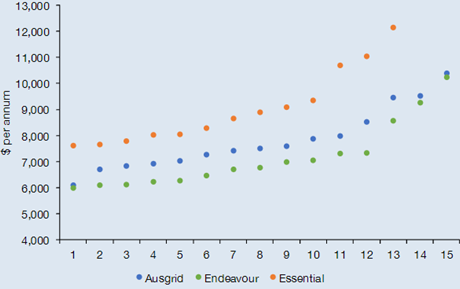 Chart 6: The price-spread for each of the three NSW distribution networks. Annual bills based on market offers as of October 2022 (including guaranteed and pay on time discounts), 20,000 kWh per annum, single rate, and GST inclusive.
So what does this mean for small businesses?
While there are fewer market offers available for SMEs in comparison to earlier this year, there are still some savings to be made for those on a high price. For example, for SMEs in NSW with a consumption level of 20,000 kWh per annum, there is a spread of offers below the ‘big 3’ retailers’ average Default Market Offer of $8,000, starting at around $6,000 for 2 of the 3 network areas.
This report is also an important reminder that while much sector consideration is being given to how we can support households, we can’t forget SMEs in this discussion. While the AER finds that in the last year, the overall average debt of SMEs remained steady, the number of disconnections has increased, broadly mirroring residential trends. The number of SMEs with debt on disconnection has also increased (65% for electricity customers and 23% for gas), with the AER encouraging retailers to work with their SME customers to avoid disconnection.
A project by Business Australia and funded by Energy Consumers Australia is looking to guide policy development in this area. Business Australia has worked with SMEs to understand how they interact with the energy market in five specific areas (seeking energy advice, procurement, energy efficiency upgrades, renewables, and becoming net carbon zero certified), to gauge their awareness and take up of what is currently on offer and assessing barriers to engagement. A report will be released in December 2022, identifying gaps in existing energy interventions and flagging ways that barriers can be overcome in future.
In the meantime, the SME Retail Tariff Tracker Project continues to be an important tool for gaining insights into the state of the retail market. This year’s results are simply a reminder that all tools of this nature require thoughtful analysis and awareness of context. And also, that unusual times can't often be understood using the thinking and methods we are used to.
About the report
Since 2016, Energy Consumers Australia has been tracking energy prices for small businesses across Australia, producing a twice-yearly report to highlight emerging trends, and a spreadsheet-based tool that allows interested parties to compare prices and produce their own analysis. Find the full November 2022 report and workbook here.