
Made famous by Top Gear are the eerily empty freeways of Naypyidaw, the capital of Burma. Constructed in 2005 at an estimated cost of $4bn, the city was built to a size four and a half times the size of London – despite having a population less than one eighth of the UK capital. To this day, the streets are largely empty, with the reasons for the overbuild unclear.
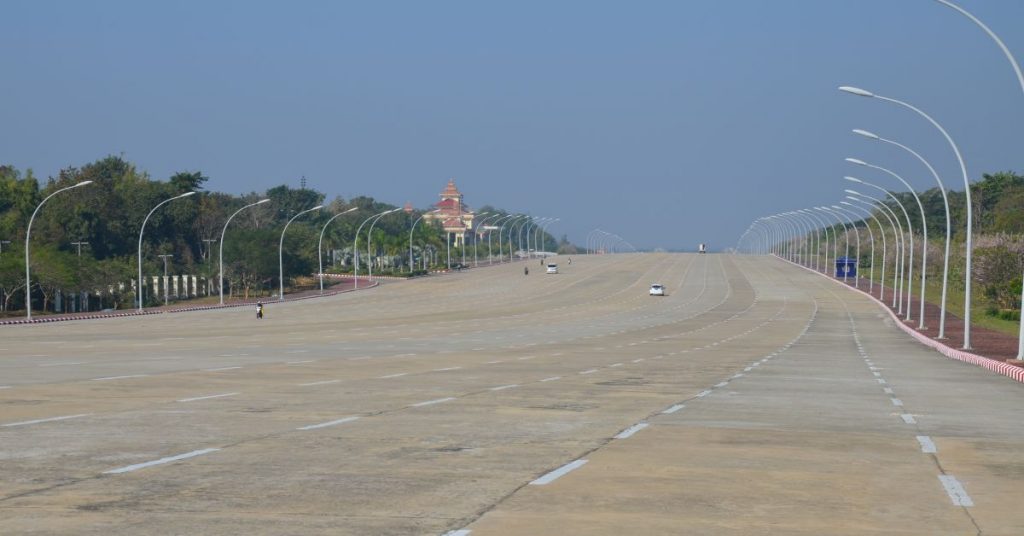
The empty freeways of Naypyidaw
Utilisation rates measure the extent to which infrastructure is used
The construction of the Naypyidaw highways is an example of extremely underutilised infrastructure. The consequence of the underutilisation is that too many resources were spent in its development. These resources would have been better allocated elsewhere – or not at all.
Understanding the utilisation rate of public infrastructure is important for planners, regulators, and consumer representatives. It provides insights into how well the infrastructure was designed, how it is currently operating, and whether it will need to be upgraded in the future.
Infrastructure will likely be underutilised for large portions of the year to serve peak demand
In the weeks leading up to Christmas, Australian consumer retail spending spikes. Department stores must plan accordingly and ensure that they can accommodate this surging peak demand.
When considering how big their stores and inventory needs to be in December, planners recognise demand will not be constant throughout each day. Instead, as most consumers work and only shop when they aren’t working, demand will likely peak on weekends or weekday evenings. As such, planners will have to plan for those specific instances. This shows that planners must spend significant amounts of resources preparing for demand that occurs in only a small fraction of the year.
Monthly Australian department store turnover – December 2013 to Dec 2022
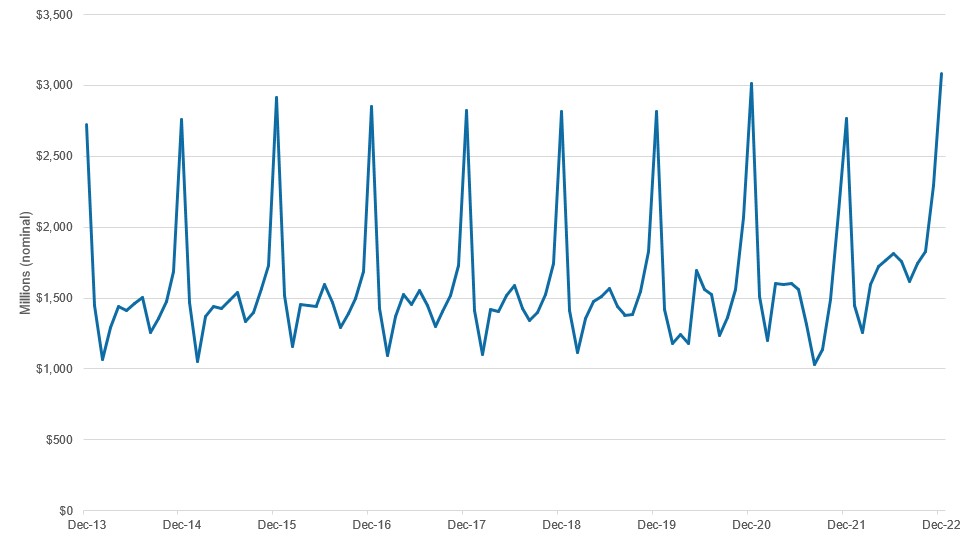
Source: ABS Retail Trade Data, Retail Trade, Australia, June 2023 | Australian Bureau of Statistics (abs.gov.au)
As the size of department stores must accommodate peak demand, department stores will likely be relatively empty – or underutilised - in every month of the year except December. This is especially true before 5pm on a weekday, and even on some days in December. Low utilisation rates for the majority of the time are an unavoidable result of ensuring the infrastructure can serve demand at times when it is most needed.
So, what does electricity demand look like, and how do electricity infrastructure planners plan for that? As a result, how well utilised are our electricity distribution networks?
Peak demand for electricity is generally in the weekday evenings in summer
Electricity demand isn’t as easy to predict as department store sales. However, as electricity demand is partly seasonal, it also faces similar design challenges.
Electricity demand is highest during summer and winter (due to the addition of heating and cooling loads). How high peak demand reaches each year is generally dependent on how hot or cold those respective years are. Within a week, demand is generally at its highest around 6pm on a weekday and decreases during the weekend.
Monthly NEM demand – January 2018 to July 2023
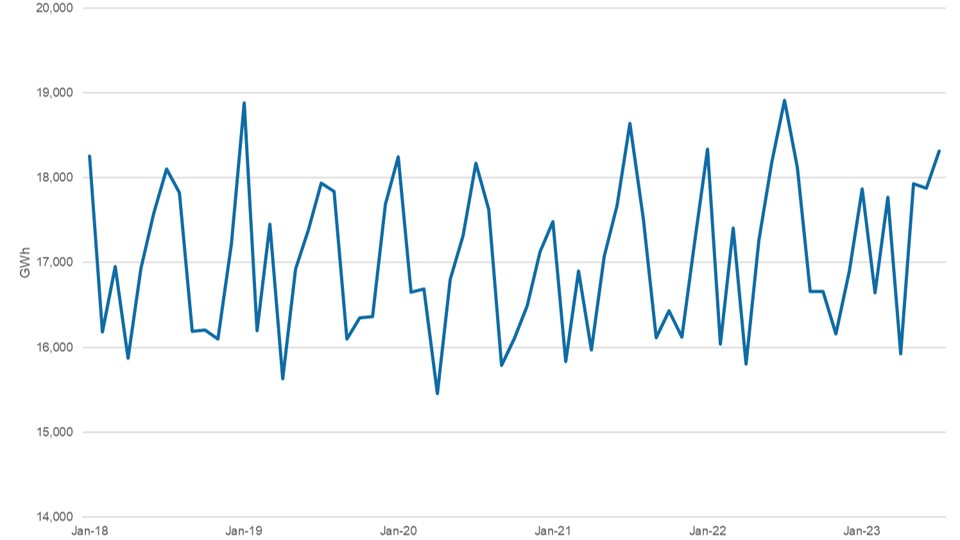
Source: Analysis of OpenNEM.
Consumers are paying more than they need for their electricity because networks are underutilised
Historically, electricity distribution network utilisation has been measured by analysing how much a business’ assets are used at times of peak demand. A utilisation rate of 100% means that peak demand equals the capacity of the network, while 50% utilisation means peak demand only equals half of what is available.
The Australian Energy Regulator has reported that the average network utilisation for distribution networks in the NEM peaked in 2006 at 57%. It subsequently decreased to 39% in 2015 and has remained stable since (currently on average 41%). This means that even at the most highly used time, the distribution network is, on average, still over 50% ‘empty’.
Range of utilisation rates of electricity distribution networks in the NEM – 2006 to 2020
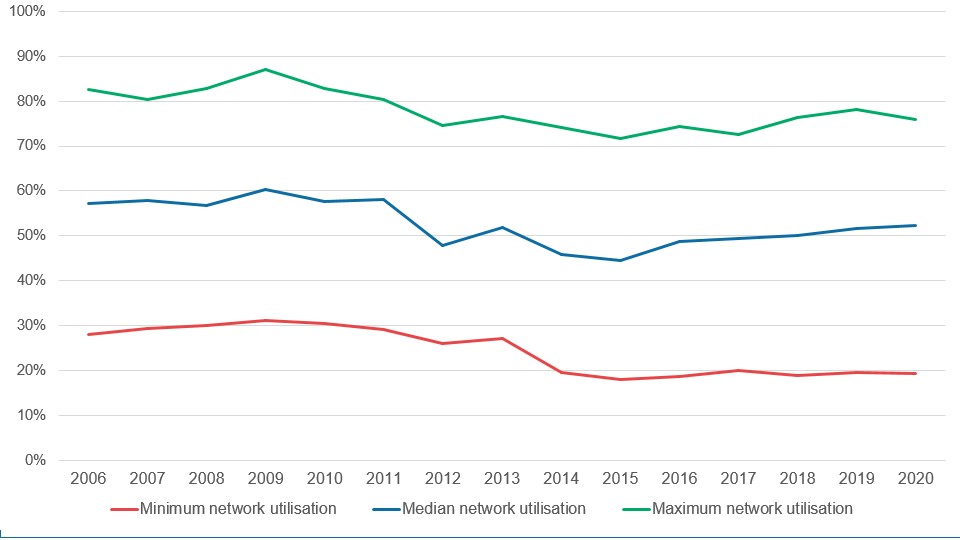
Source: AER, State of the Energy Market Report 2022
Low levels of electricity distribution network utilisation have been attributed to several factors. Heightened state reliability targets, responding to increasing peak demand during the 2000s, required networks to significantly invest in the grid to reduce risks of major blackouts out of concern for continuing increasing demand. Contrary to these concerns, peak demand decreased in the early 2010s, meaning this investment wasn’t necessary. The ACCC has also argued that the previous regulatory regime allowed networks to overinvest in the grid.
ACCC analysis of retail electricity prices found that between FY08 and FY14, total network costs (across both transmission and distribution) increased by 68% in real terms. In 2017, the ACCC estimated that residential customers in NSW, Queensland and Tasmania were paying an additional $100-$200 per year in their electricity bills because of the previous overinvestment.
If network utilisation can increase, electricity prices can be lowered
Network costs account for a material portion (45%) of what residential consumers pay for their electricity bill. Distribution costs alone account for around 34% of electricity prices.
Electricity demand is likely to increase over the coming years because of the electrification of vehicles, buildings, and other sectors. In the short-term, the current low network utilisation rates could mean that distribution networks are well placed to accommodate this increased load without the need for major improvements. In the longer term, if distribution networks continue to increase utilisation, instead of upgrading the grid (through actions like demand response), distribution charges to customers can decrease.
Overly high distribution network utilisation rates pose risks
While distribution networks should be looking to increase network utilisation, overly high utilisation should not necessarily be the goal. Overly high network utilisation poses greater risks of blackouts, which if last long in duration, could have catastrophic consequence.
It is reasonable for planners to be risk averse when planning to ensure these events are unlikely to happen. However, this risk aversion needs to be commensurate with the value consumers place on reliability.
The way distribution networks are being used is changing
Historically, electricity distribution costs were driven largely by the need to augment the network in response to growing demand. However, distribution networks are now having to adapt to other emerging factors.
As consumers and communities invest in rooftop solar and batteries, distribution networks are now being used increasingly to accommodate the output from these resources. No longer are distribution networks one-way highways, instead they transfer electricity to, and from, the consumer. The National Electricity Rules were only amended in 2021 to recognise this new role for the network.
Consumer investment in rooftop solar is so large that the output from rooftop solar is offsetting electricity consumption resulting in record breaking lower levels of minimum demand. In late 2021, South Australia incurred the first instance of net negative demand on its transmission network when renewable output exceeded consumption.
Measures of network utilisation will need to change to reflect changes in how distribution networks are used
As distribution networks adapt during the energy transition, the way we measure electricity distribution network utilisation will also need to change. Better metrics can help inform network planning to ensure a least-cost energy transition.
New metrics will be needed to measure the level of two-way flows across the distribution network to understand how it is being used on a day-to-day basis. In addition, metrics will be needed to understand how networks are accommodating net negative demand.
Utilisation rates will also likely vary significantly in different locations within a network due to differences in loads and rooftop solar penetration. Aggregate utilisation measures do not capture these differences. By measuring utilisation in individual locations of the network, planners can identify where specific assets are underutilised, potentially identifying uses for non-network solutions to reduce costs (e.g., microgrids) to prevent risks of asset stranding in the future.
While there are many changes that will need to occur as our energy system transitions, introducing these new metrics is one concrete and easy to take step to ensure that consumers are better off.