

Since 2016, Energy Consumers Australia has been tracking energy prices for small businesses across the nation and issuing a twice-yearly tariff tracker.
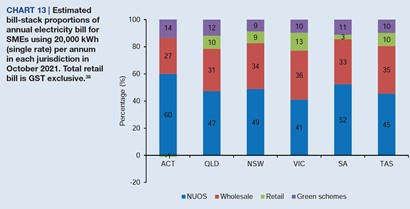
The tracker not only keeps track (literally) of how much small businesses are paying for gas and electricity in each state and territory it also identifies the different parts that contribute to each energy bill (the cost stack) and allows those who make and shape policy for small businesses and in the energy sector more broadly, to identify the impact of changes and the trends that emerge over time.
December’s SME TT is now out. Rather than simply run through the results, we thought we’d give you five key insights that are contained within this treasure trove of information.

1. Average bills are continuing to go down
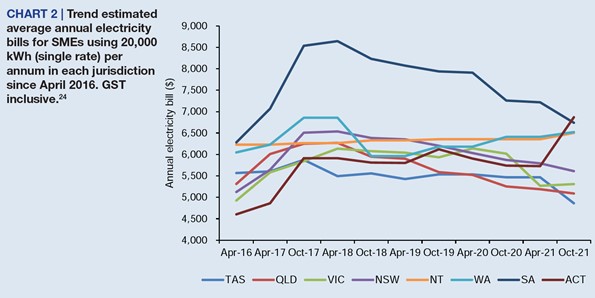
During 2021 we’ve seen the average electricity bill for small businesses across Australia with a consumption level of 20,000 kilowatt hours per annum decrease by around $110 or 2%. This is the sixth tracker in a row to report lower average electricity bills for most Australian small businesses and follows a similar trend reported for residential bills (where prices have been declining since 2017). This time, the greatest decreases occurred in Victoria (12%) and Tasmania (11%) with South Australia, NSW and QLD also reporting a reduction in bills.
It comes at a time when we are hearing more and more about the positive impact of renewables on wholesale electricity prices. In every jurisdiction wholesale prices are lower than they were this time last year. This is particularly true in South Australia where they decreased by more than 30%. The state is known for its high rates of residential solar and on a sunny Saturday in October broke a world record as renewables accounted for 135% of total demand.
For the medium term future it appears this trend is likely to continue. The ACCC this week released their Inquiry into the National Energy Market report, recording a decrease of 11% for small business wholesale costs over the past two financial years. They predicted this percentage will only grow alongside greater penetration of renewables in the grid and will continue to monitor whether retailers are passing on reductions in wholesale costs to consumers.
2. Electricity bills aren’t decreasing everywhere
Not everyone has enjoyed a reduction to their electricity bills. While it’s useful to look at national averages for a broad picture of what small businesses are paying for their energy , we can see significant variety between jurisdictions. States are transitioning to renewables at different rates while unique policies can have visible impacts on their corresponding jurisdictions.
Most noticeable this time around is the ACT, where the Government’s commitment to supplying 100% renewable electricity has resulted in the territory having a 20% increase in electricity bills for small businesses that consume 20,000 kilowatt hours per annum.
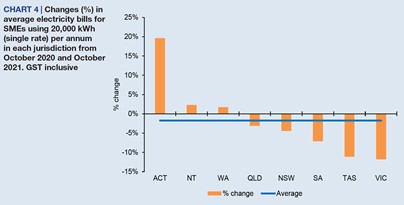
The cost of supplying 100% of electricity from renewable sources is recovered via Network Use of System (NUOS) charges which are set annually in July for the ACT and approved by the Australian Energy Regulator. NUOS charges alone increased 42% in the ACT compared to the same period a year ago.
3. The Default Market Offer is bringing standing offer prices down
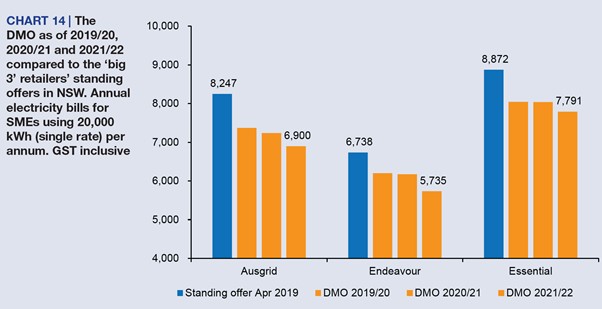
The consistent and regular reporting of the tracker allows us to identify the impact different policies are having on energy bills. It’s already given us a clearer idea of the effect of the ACT’s renewables policy but even more significant is the introduction of the Default Market Offer (DMO) in NSW, South East Queensland and South Australia, and the Victorian Default Offer (VDO) in Victoria in July 2019. (The DMO does not apply to Tasmania, ACT, Northern Territory or Western Australia where electricity prices continue to be regulated).
A core policy objective of the DMO/VDO was to reduce the “unjustifiably high” prices customers on standing offers were paying. The tracker allows us to understand how successful it has been so far in achieving this objective.
When compared with bills before July 2019, the DMO/VDO has lowered standing offers for businesses in all jurisdictions. Victoria has seen the greatest reduction at 30% followed by South Australia (19%), South East Queensland (17%) and NSW (14%). Just over two years after its introduction, the DMO/VDO is already having tangible effects on electricity prices and it will be interesting to see whether it continues to push prices in the right direction over coming years.
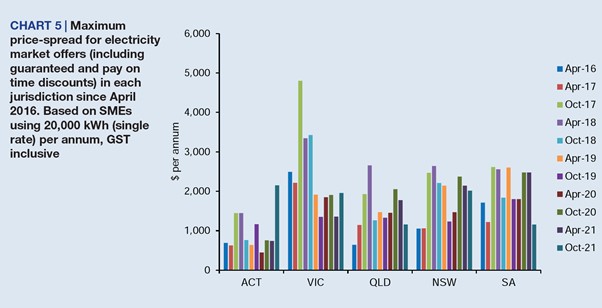
4. Price-spread has gone down
The introduction of the DMO/VDO had the potential to impact another element measured by the tracker: the variety and spread of retail offers. Price-spread, the difference between the lowest and highest market offer, is one way of measuring the existing variety in offers. Immediately after the introduction of the DMO/VDO in 2019 we saw a significant drop in this difference across the four jurisdictions. And while price-spread increased again in the following tariff trackers, the current tracker has revealed a decrease across each jurisdiction, with South Australia the lowest since we began tracking.
What does this have to do with the DMO/VDO? If retailers have lost their high-priced, revenue-raising standing offers, they may no longer be able to produce the cheap offers at the other end of the spectrum. Some argue that if this goes too far, consumer choice will be negatively impacted, particularly for those consumers who are hunting around for the best-priced offer. However, the other side of this argument is that declining price spread reduces the potential for consumers to be overwhelmed by an excessive number of offers with little real difference between them. Where there is too much choice, consumers may find navigating the market overly complicated and could disengage completely. In our recent submission on the DMO we argued it is a fine line we are treading and one that will be interesting to keep an eye on in following trackers.
5. Small businesses aren’t on the best offers
As small businesses recover from the upheavals of the last two years, it’s more important than ever that they are not paying more than they have to for energy. While price-spread is decreasing, there remains a significant difference between the highest and lowest offers. A business on the highest priced electricity offer in the ACT consuming 20,000 kilowatt hours per annum could be paying $2150 more than those on the lowest offer. The same can be said for gas where the difference between the highest and lowest offer has increased in all jurisdictions except the ACT. Small businesses consuming 100 gigajoules per annum could save between $975 and $110 if they swapped to the cheapest offer.
The tracker doesn’t report on how many businesses are on which offer but there is reason to believe small businesses aren’t shopping around to the same extent as households. Earlier this year the ACCC raised concerns that small businesses were not switching from standing offers to cheaper market offers. 16% of small businesses remain on standing offers, more than double the proportion of residential customers. Despite the DMO resulting in reductions to standing offer prices, they remain some of the most expensive offers available.
There’s a lot of positive news stories when it comes to electricity prices and there’s no doubt the impacts are being felt by small businesses. However, like always, there are elements we could be improving or, at least, keeping a watchful eye over. The energy system and market are transitioning rapidly and new policies will continue to affect small businesses. While this is happening, we will continue to track their impact and the trends that emerge.