Have you ever heard a politician, or a businessman, tell you that some price increase is ‘no more than your daily cup of coffee?’
How much does a cup of coffee cost? In dollar terms, that depends on where you live and what kind of coffee you like. Conveniently on 17 November 2017 card processing company Square published a Coffee Report.[1]
That report tells us how much different coffees cost in different states and territories and how many of us like each type of coffee: (see figure below)
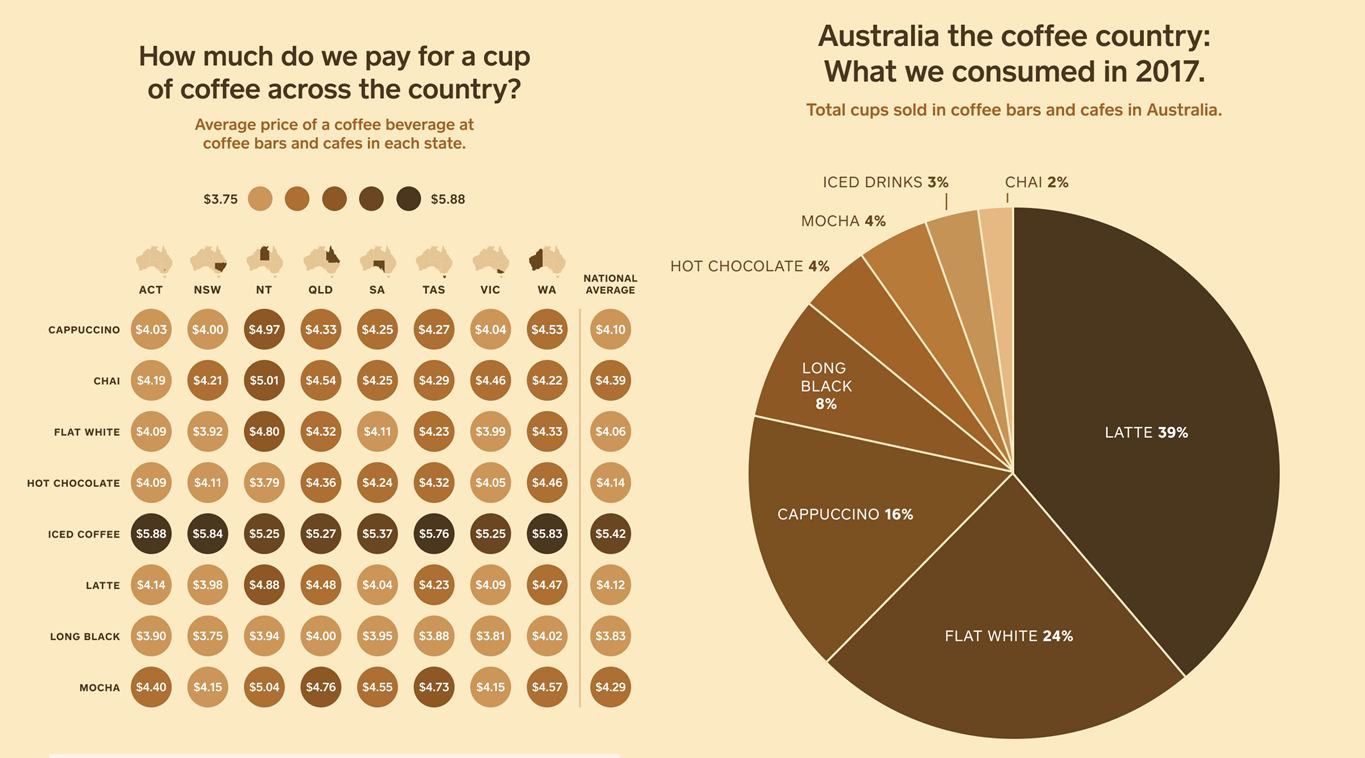
The national average is neither the straight average nor a population weighted average for each coffee type so we can only infer that it is weighted by relative coffee popularity by State or Territory.
Combining both data sets gives us a simple ‘representative coffee price’ of $4.13.
Table 1: Representative coffee price
| COFFEE TYPE | REPORTED NATIONAL AVERAGE |
PROPORTIONS |
| Cappucino | $4.10 | 16% |
| Chai | $4.39 | 2% |
| Flat White | $4.06 | 24% |
| Hot Chocolate | $4.14 | 4% |
| Iced Chocolate | $5.42 | 3% |
| Latte | $4.12 | 39% |
| Long Black | $3.83 | 8% |
| Mocha | $4.29 | 4% |
| Representative coffee price | $4.13 |
Table 1 source: Square Coffee Report
But what is the significance of this number? The table below lists the pre-tax weekly income of a representative sample of people in Australia.
Table 2: Weekly sample income per energy market position
| SAMPLE INCOMES | WEEKLY |
| Chair, ACCC | $14,629 |
| Chair, AER | $10,449 |
| MP Base Salary | $3,983 |
| Prime Minster | $10,355 |
| Cabinet Minister | $6.870 |
| Senior Network Engineer | $2,221 |
| MD of Network Owner | $38,396 |
| Average Weekly Earnings | $1,653 |
| Single Newstart with Dependents | $590 |
| Single Aged Pension | $908 |
Table 2 source: Remuneration Tribunal[2], ABS, Dept of Human Services[3], Company Annual Report and payscale.com[4]
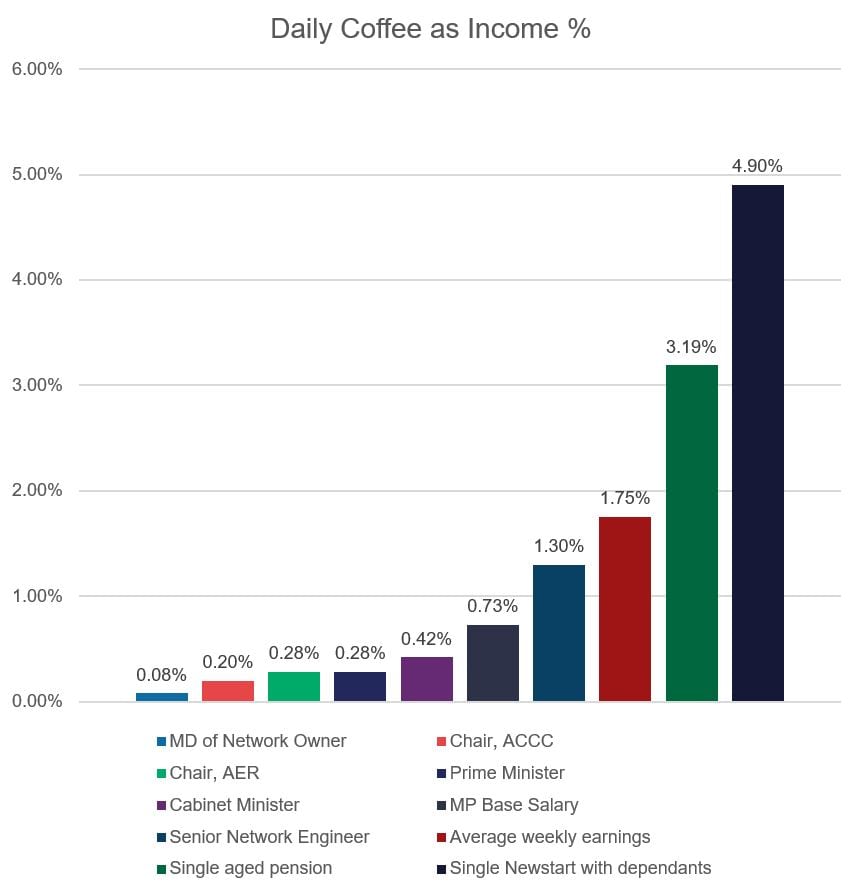
Using this weekly income data and our ‘representative coffee price’ we can derive the percentage of weekly income that a coffee a day would represent for each of these individuals. This is provided below and ranges from a low of 0.08% for the MD of Network Owner through 0.42% for a cabinet Minister to a whopping 4.9% for a single with dependents on Newstart.
A coffee a day is a lot of some people’s income
Graph 1: Daily Coffee as Income %
This approach only uses the reported gross payments for these jobs, while our coffee (and energy bills) are paid for from disposable (post-tax) income. The chart below shows the cumulative distribution of weekly disposable income and what a cup of coffee a day is for each income.
Graph 2: Equivalised disposable income cumulative distribution and coffee as % income
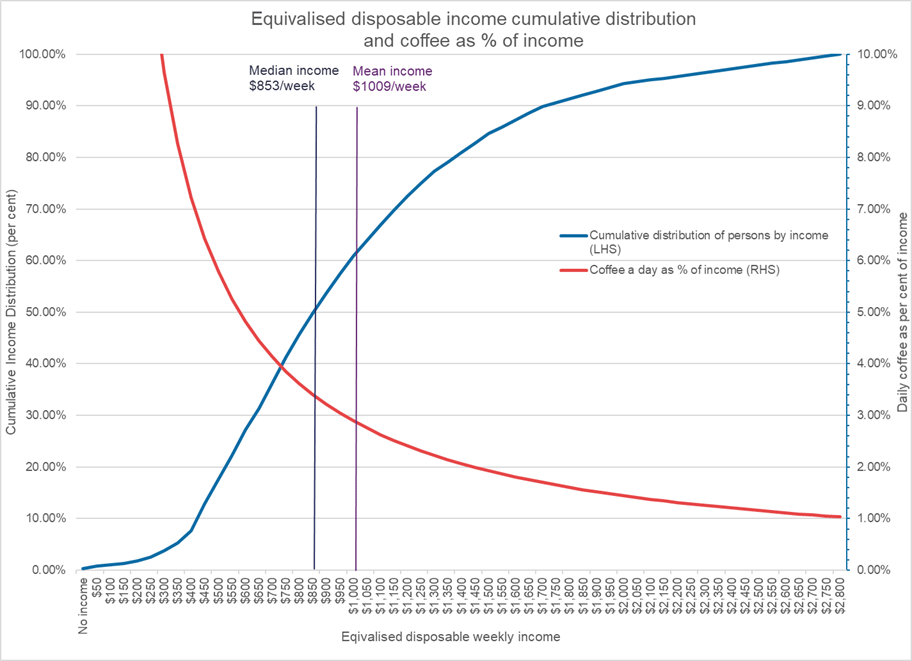
Source: ABS 6523.0 2015-16[5]
Summary
For people on the median income, a cup of coffee a day is more than 3% of their disposable income. For more than 80% of the population a cup of coffee a day is more than 2% of disposable income.
When someone is relating a price rise to your ‘daily coffee’ they are telling you more about their income than they are about the price impact on households.
[1] https://squareup.com/au/townsquare/2017-square-australian-coffee-report
[2] https://www.remtribunal.gov.au/
[3] https://www.humanservices.gov.au/individuals/services/centrelink/age-pension/eligibility/payment-rates
[5] http://www.abs.gov.au/ausstats/abs@.nsf/mf/6302.0